Course Description
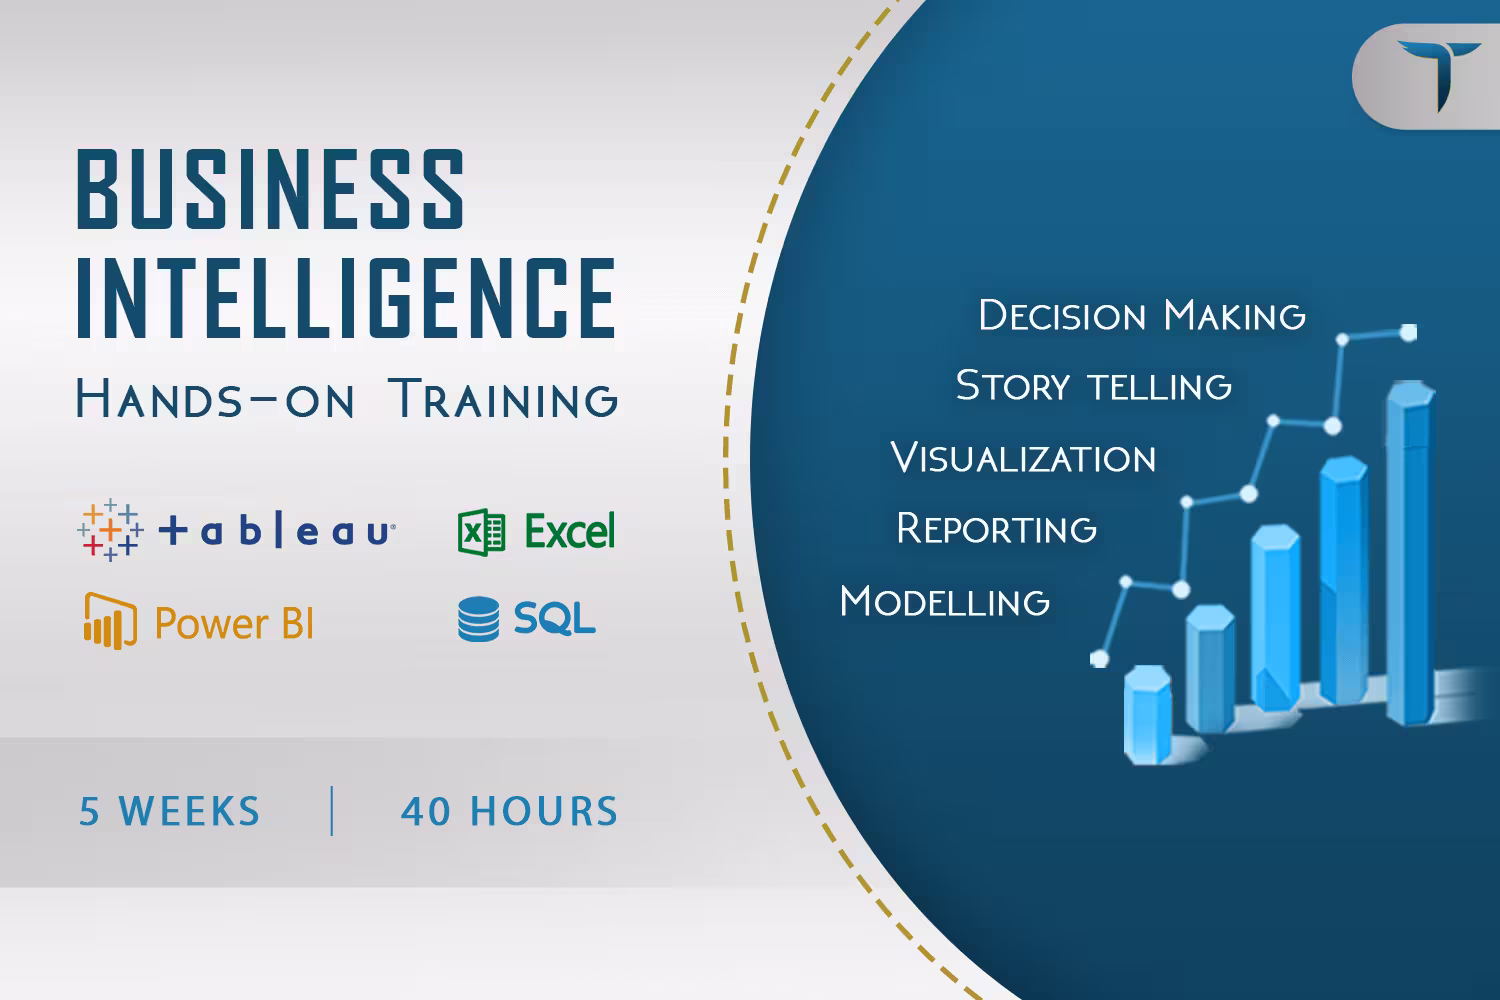
Offering a 5-week hands-on training, Reporting and visualization of data to get the complete insights of business for better decision making.
Participants will master business intelligence using the top tools of BI; Power BI, Tableau, Excel and SQL in order to support the business in a better and structured way.
What You’ll Learn From This Course
- The fundamental concepts and principles of business intelligence, such as data warehousing, ETL (extract, transform, load), data visualization, and data analysis.
- How to model data for BI purposes, including designing dimensional data models and implementing data hierarchies.
- How to write SQL queries to extract data from relational databases, perform joins, and aggregate data.
- How to create ad hoc reports using tools such as Excel and Power BI, including creating pivot tables, charts, and graphs.
- How to use Power BI and Tableau to create interactive dashboards and visualizations, including designing layouts, selecting appropriate visualizations, and applying filters and slicers.
- How to use data analytics techniques such as clustering, segmentation, and regression to gain insights from data.
- How to present findings and insights to stakeholders effectively, including creating reports, presentations, and dashboards that communicate insights clearly and accurately.
Introduction to BI & Data Modelling
 Introduction to Data Warehouse & BI
- Business Intelligence & its importance
- OLAP – Dimensional Modelling Fundamentals
- Dimensional Modelling Design with industrial use case
- Build & deploy Semantic layer
- Design Steps – Kimball’s Dimensional Modeling (Hands on)
- Implementation – Kimball’s Dimensional Modeling (Hands on)
- Managing DWH history through Slowly Changing Dimensions (SCDs) with use cases
- ROLAP vs MOLAP vs HOLAP
- Design & implementation of Kimball’s Dimensional Model technique – Semantic layer Readiness
By the end of this course, the candidate should have a complete understanding of BI & Data Modelling
SQL Ad-hoc Reporting & Analysis
- Introduction to SQL – Query language for Data Warehouse
- DDL vs. DML vs. DCL
- Creating Databases, Tables & defining attributes
- BTEQs & Table types – Set vs Multiset
- Views / Materialized views
- Stored Procedures & Functions
- Indexing & Constraints
- Aggregate functions, Window aggregate functions, Order analytical function
Microsoft Excel
- Loading, Cleaning & Preparing data
- Managing the Data Model
- Pivot Table for Data Analysis
- Lookup Functions, Aggregate Functions & Merging techniques
- Data Analysis using Charts & Visualizations
Microsoft Power BI
- Connect & Get Data from multiple Data sources
- Data Connection/Storage modes – Import, Live, Direct Query & Dual
- Reshaping and Transforming Data in Query Editor
- Data Enrichment (New business Fields)
- Data Modelling
- Understanding Cardinalities
- Understanding Filter Context
- Building Interactive Visualizations on implemented Dimensional Model
- Animated Visualization Implementation
- Roll-up/Roll-Down Capabilities
- Introduction to DAX Language
- Custom visualization in Power BI
- Creating DAX Measures
- Evaluating DAX Measures
- Leverage Calculate Functions functionality
- Time Intelligence – MTD, QTD and YTD Date Calculations
- Introduction to Power BI Services
- Scheduling Automated Reports Refresh
- Sharing Reports & Dashboards
- Mobile Dashboard Design
- Performance monitoring & debugging a slow running report – DAX Studio
- Business Use Case implementation in Power BI (Assignment)
By the end of this course, the candidate should have a complete understanding of BI Reporting & Analysis
Tableau
- Connecting with Different Data Sources in Tableau
- Data preparation with Tableau
- Live Vs Extract
- Data Source Filters
- Basic Report Creation
- Understanding of Rows and Columns
- Leveraging the Use of Marks Labels to enrich information in Reports
- Visualization best practices with real world examples
- Grouping fields in Tableau
- Interactive Filters
- Types of filters
- Advanced Filter Calculations
- Enhancing user interactivity thorough parameters
- Pages
- Maps in Tableau
- Importing custom geocoding in Tableau
- Visualize your data on map through spatial files
- Building a Dashboard
- Leveraging the use of Interactivity in Dashboards through Actions
- Designing and implementation of dashboard
- Designing of dashboard for mobile & Tablets
- Extensions
- Enriching information by creating Calculated Fields
- Calculation Syntax
- Date/Logic/String Calculations
- Advance Calculations (LODs)
- LODs & real-world Use cases
- Visual analytics
- 80-20 rule – Pareto Chart
- Business Use Case implementation in Tableau (Assignment)
- Career counseling & Final Assessment
By the end of this course, the candidate should have a complete understanding of Tableau

Saba Farooqi

ASSOCIATE PRACTICE MANAGER, BUSINESS INTELLIGENCE AT TERADATA
Saba Farooqi has over 13 years of extensive experience in Business Intelligence & Data warehousing solutions with a focus on access layer design and foundation layout. She has managed teams and created benchmarks in semantic data modeling in the telecom sector of Pakistan apart from ensuring on-time delivery of programs & projects as a product owner. With an emphasis on effective communication with stakeholders, she has expounded complex business objectives and product requirements to develop consensus over solutions and ensured customer satisfaction.

Yasir Mehmood
BUSINESS INTELLIGENCE CONSULTANT AT TERADATA
A Computer Science graduate by qualification and a developing data enthusiast by choice, Yasir Mehmood holds over 7 years of industry experience in the field of technology, data analytics, data warehousing, EL/TL, data mining, reporting & visualization. His qualifications & actual job in the field of Business Intelligence & Data Warehousing have provided him with a well-rounded background and enabled him to develop an analytical/logical approach to tasks, software skills, and the ability to work under pressure.
 Duration
 Timings
 Hours
Hours Already Registered? Proceed directly to payment